Customer experience metrics made simple
How to measure customer experience (CX) using key metrics

Customer experience (CX) has become a competitive differentiator that can make or break your business. The CX metrics used to track, measure, and act on customer feedback are all important—but which will provide the best insight into your customers’ world?
It depends on the type of outcome you’re seeking. Do you want to build brand loyalty and reduce churn, or ease the customer burden in key areas of their journey? There’s a metric for just about any CX goal you have in mind.
While it can seem overwhelming, we’re here to help. In this guide you’ll find the most popular customer experience metrics, cataloged by purpose and use case. If you're a seasoned CX professional, this library can strengthen the connection between your efforts and results. If you’re just getting started, this list can help you create a plan.
The three most commonly used customer experience metrics are Net Promoter Score® (NPS®), Customer Effort Score (CES), and Customer Satisfaction Score (CSAT). Most companies use at least one of these metrics to measure their customer experience program. Ideally, you should use all three. Let’s go over each one.
Examples of customer experience metrics
Net Promoter Score (NPS)
NPS is a popular metric—it’s a simple, easy-to-understand survey that measures customer loyalty and advocacy. It’s also the most commonly used benchmark for CX, used by two-thirds of the Fortune 1000.
Net Promoter Score (NPS) is the result of asking: “How likely are you to recommend us to a friend or colleague?”
The respondent ranks their likelihood on a scale of 0 to 10—0 being highly unlikely, and 10 being extremely likely. People who select 9 or 10 on the NPS survey are considered promoters, 7 or 8 are passives, and people who select 6 or below are detractors.
To calculate the NPS score, subtract the percentage of detractors from the percentage of promoters (percent promoters – percent detractors = NPS).

You can add a comment option to your NPS survey or ask one open-ended question to give customers a chance to explain their ratings.
NPS scores vary by industry, but generally, an NPS rating above 0 is considered good; above 50 is considered excellent; and a 75 and above is world-class.
Use NPS to create a customer-centric culture
The Net Promoter Score is often used as a relationship metric to evaluate the overall customer relationship and end-to-end experience.
It’s a great indicator of how your customers feel about the overall brand and relationship, and can be a valuable tool in improving the customer experience. But that’s only if it’s used consistently and the results are communicated throughout the company so teams can take action.
Here are some ways to put your NPS data to work:
- Recognize patterns and act. If you notice repeat issues, share and strategize with the appropriate team to make improvements. For example, if delivery is frequently mentioned as an issue to your detractors, get your delivery team involved in the CX conversation.
- Connect with your Promoters. Promoters took the time to share their positive feedback. Show them your appreciation by inviting them to your customer advisory boards or special customer events. Some CEOs even call a few promoters directly each month to say thank you!
- Don’t shy away from your detractors. Listen to their complaints—letting them share concerns directly with you is a great way to recover from a potentially problematic event or avoid unnecessary issues in the future.
An NPS survey can be applied at specific touchpoints in the customer journey. For example, you could use a variant of NPS (“Would you recommend us to a friend?”) after support calls to determine the effect of customer service on customer loyalty.
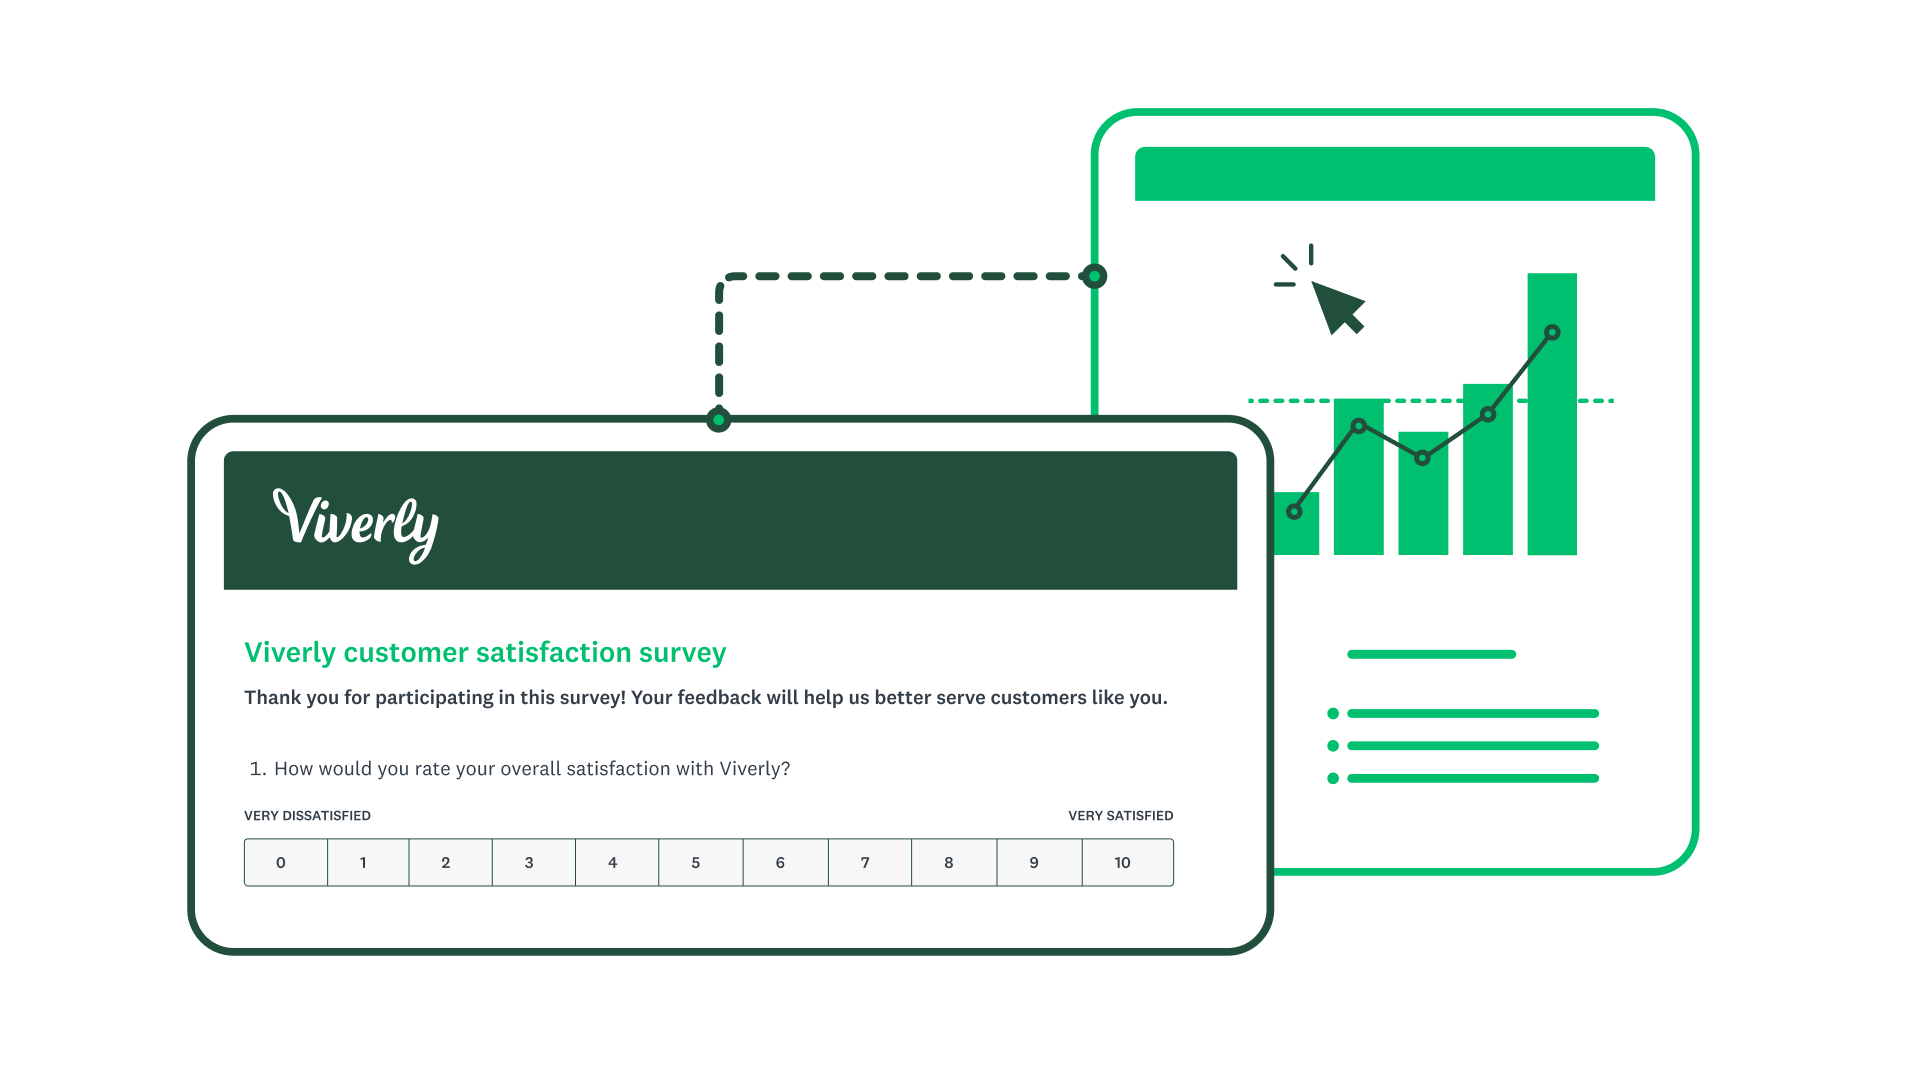
Customer Satisfaction Score (CSAT)
The Customer Satisfaction Score is assessed by asking customers: “How would you rate your overall satisfaction?” with your company and its products, services, and interactions.
A five-point scale is most commonly used, with options very unsatisfied, unsatisfied, neutral, satisfied, and very satisfied.
There are two ways companies can calculate CSAT: an average of 1-5 or by focusing on the 4-5 responses.
SurveyMonkey recommends using this formula: (Number of 4 and 5 responses) / (Number of total responses) x 100 = % of satisfied customers.

While you can use CSAT as an average, it’s more useful to calculate the percentage of those customers who consider themselves satisfied—the metric is designed to identify the percentage of happy customers.
The final score is typically represented as a percentage of the maximum. For example, with a five-point scale, a CSAT rating of 80% means that the majority of customers are giving a satisfied rating (4 out of 5). Like an NPS survey, a CSAT survey gives the option for respondents to leave a comment and explain their rating.
A CSAT score of 80% is a good indicator of success, although it will vary by industry. For the latest CSAT benchmarks, check out this article.
CSAT pros and cons
A CSAT study is easy to understand and implement—most people are comfortable answering the question of rating a brand on a scale of 1-5.
However, the wording of the CSAT question is not standardized, making it difficult to compare scores between different organizations. And, a satisfied customer is a fairly low bar that may give organizations a false sense of security because it doesn’t necessarily lead to loyalty.
Like NPS, the Customer Satisfaction Score is considered a relationship metric, which means it should be used to evaluate the overall customer relationship and end-to-end experience. For this particular purpose, CSAT should be measured annually or quarterly, to assess a customer’s satisfaction with their experience over time.
Customer Satisfaction Score is a touchpoint metric. That means it’s used to capture feedback after a specific customer interaction with different parts of a company. So, instead of understanding overall customer happiness, CSAT can zero in on a single stage, touchpoint, or relationship.
Customers may have a tendency to focus on their most recent experience with a company in an NPS survey. However, the 5-point scale of CSAT can apply to specific instances, such as a customer service call or delivery experience.
Use CSAT to improve touchpoints along the journey
Customer-centric brands use CSAT with the intention of creating specific improvements along the customer journey. Here are some examples.
- Use CSAT to incrementally measure touchpoint improvements. Once a touchpoint is changed for the better, validate it with customers by comparing before and after CSAT scores.
- Identify the specific goals a customer has at each stage in their journey; then use a CSAT study to understand if those goals are being met. If satisfaction is lower at a particular stage, that’s where improvements should be prioritized.
- Use CSAT to track the satisfaction of big, complex interactions. Examples include lengthy buying cycles and complex B2B service issues that aren’t resolved with just one call. Once the situation is resolved, ask the customer about their satisfaction level. Service recovery should build loyalty by taking care of customer problems. If that’s not happening, a CSAT survey will tell you.
- Review CSAT throughout the journey. Even if you are collecting CSAT at specific interaction points, take a step back and review the big picture of these scores within the customer journey. The lower scores highlight gaps in the experience. Address those improvements and watch the scores rise again.
By being hyper-focused on specific interactions, CSAT helps you discover gaps in your customer experience program and make improvements across the customer journey.
Related: 50 examples of great customer satisfaction survey questions
Customer Effort Score (CES)
The Customer Effort Score (CES) asks the customer to score the amount of effort involved with a specific interaction. According to our research, 82% of customers say they've backed out of an online purchase due to a negative experience, such as hidden fees or difficult website navigation. Evaluating CES can pinpoint problems and help companies reduce costs and customer frustration.
A CES survey asks customers to agree or disagree with the statement: “[Company Name] made it easy for me to handle my issue.” You can also include an open-ended follow-up question that asks for feedback on the response. The respondent can choose from 7 answer choices ranging from strongly disagree (score 1) to strongly agree (score 7).
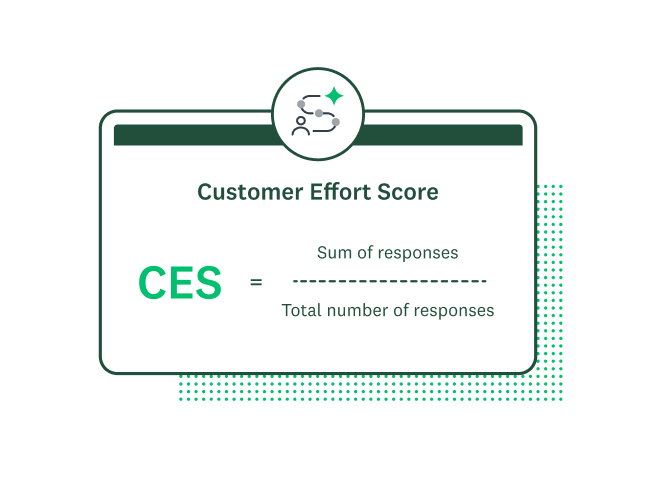
A CES is the average of all responses by adding up the total sum of responses, and dividing by the total number of survey respondents. The equation looks like: (Total sum of responses) / (Number of responses) = CES score.
An average Customer Effort Score over 5 is good. A score 5 and lower means there is room for improvement. Some theorize that you actually don’t want a perfect score, because that shows your customers aren’t putting in any effort themselves to get their questions answered. Somewhere between 5-6 is the sweet spot. If you’re averaging at a CES of 7, especially when scaling a support team, you might want to encourage more self service options.
Why CES matters
The Customer Effort Score has gained popularity as a metric aimed at reducing the effort in customer service or other routine interactions. If the primary value proposition of your brand is fast and easy experiences (think Amazon) then CES could work well as a brand loyalty indicator. However, for the rest of us, CES is best used in customer service or other routine experiences where low effort is the main loyalty driver.
As you may have noticed, CES is another touchpoint metric. As effortless experiences become the expected norm, this metric will help guide your strategy to create less effort for customers throughout their journey.

Use CES to reduce effort at key touch points
Successful CX programs use CES to measure how a customer feels across the journey and what actions are leading them to feel that way. Here are some examples:
- A customer might report high satisfaction with the buying phase (via CSAT), while also reporting that the purchase online required more effort than they would’ve liked (via CES). Determine which factors led to the feeling of effort for the customer, then provide improvements or peripheral guidance like additional instructions, online support, real-time chat, etc. Finally, measure CES once more and see the results of your efforts.
- Tie your CES score to referrals and word-of-mouth marketing. When you bring your CES up, you might notice your referral rates and social media sentiment increase. This can also be measured in reverse—as your CES dips, pay attention to the way customers are discussing your brand.
- CES is great for soliciting open-ended feedback from customers who may have great ideas on how to reduce the effort for their fellow customers.
Examples of customer loyalty metrics
All customer experience metrics can give insights into customer loyalty. However, there are measurements that can predict more precise levels of customer loyalty.
Loyalty is an emotional state that is reflected in the behaviors that customers exhibit with your brand. Loyalty indicators reveal themselves when you ask:
- Do customers stay with your brand or go to your competitors?
- Are they buying more from your brand?
- Are they willing to pay a premium?
- Will they refer your brand to others?
Let’s explore ways to track these behaviors to help predict how loyal customers feel about your brand.
Customer Retention
Customer retention is the most straightforward way to track customer loyalty, as it measures how long your customers stay with your brand. While the concept is straightforward, there are different ways of tracking retention, so be sure to use the method that makes the most sense to your company.
It’s important to distinguish customer retention from customer churn rate. Retention looks at: “This many customers, from this specific group, stayed this month.” While churn addresses: “This is how many customers left this month, compared to our overall customer number.”
This can get confusing, so here are some easy definitions:
- Customer retention = the percentage of existing customers who stayed this month.
- Churn = the percentage of customers who left this month compared to all customers this month (including those just acquired).
So, let's say at the start of a month, there are 100 total customers. Of this group, 80 are ongoing customers, 20 are new, and 10 leave at the end of the month.
- Retention rate = 87.5% retention (80 - 10 = 70 ÷ 80)
- Customer churn rate = 10% (10 ÷ 100)
When possible, track retention based on the individual customer journey. Retention should not be measured as a whole number (e.g., comparing the number of customers year-over-year) because that may include new customers and ignore churn.
By tracking at the individual level, you’ll be able to determine the percentage of customers who remain and the length of time they are likely to stay. For instance, if you know how many customers remain until the sixth month, you can evaluate those key touchpoints on the journey.
The retention rate is a powerful metric. Think of customer acquisition costs (CAC) that involve sales, marketing, onboarding, etc. One study reported that CAC has increased by 222% over the past eight years.
Now compare that with the costs associated with keeping a customer. To keep that customer requires far less time and resources—and the gains are much higher. And if customers are sticking with you longer, they are telling you they are happy with the experience.
Examples of business outcome metrics
Customer experience metrics are powerful, but they only tell one part of the story. You must combine CX results with business outcomes to give context and actionable insights regarding your organization’s performance. This section explores some of the most common methods used to demonstrate that your CX results are driving business growth for your company.
Overall revenue results
Making the connection between your company’s revenue and your customer experience efforts is key to a CX program’s success—and it’s easier to demonstrate than you may think with the right baseline and consistent metrics in place.
As an example, if you track how your CX improvements are positively impacting your NPS results, you'll begin to see there is a relationship to customer loyalty, and overall customer lifetime value.
There are also established benchmarks for certain industries, most well-known is Forrester’s Customer Experience Index. Forrester's CX Index™ shows how a 1-point improvement on the index leads to annual incremental revenue per customer. Apply this to your organization, and the results could be significant.
Sales metrics
Sales teams play a critical role in shaping customer expectations and perceptions as well, yet they are often disconnected from broader customer experience efforts. This is a missed opportunity to link CX to financial outcomes. A win-loss program, for example, involves post-sales research that uncovers successes and failures in the selling process. As an early and influential touchpoint, sales can provide research into the overall CX program while ensuring a consistent customer experience.
There are several ways insights from the sales process can inform your CX program. Here are some examples.
- Start with an NPS study. It’s easy to add to the end of a transaction or customer interaction, and can uncover if a customer experience met any expectations set by sales.
- If the average sales cycle is getting shorter, you can tie it to the customer experience.
- Customer Effort Score (CES) can improve word-of-mouth (WOM) marketing. If customers feel like your brand provides an easy, effortless experience, they will advocate for your brand. Positive WOM marketing also leads to more proactive sales.
Cost of customer service
Providing excellent customer service is a pricey endeavor for companies because it requires substantial staffing, training, support systems, and management oversight to handle customer issues effectively. These expenses can increase when this part of the customer journey burdens customer services teams by way of escalations, returned products, returns processing, and more.
When customers are happy, they don’t need to call your contact center to complain or request help; they are moving through their journey with strong guidance and the right expectations. This means that a company’s service resources are optimized as they should be.
Simply put, better customer experience often leads to reductions in the cost of customer service. Connecting CX metrics, like CES or CSAT, to costly CX expenses is a worthwhile venture—these metrics can flag where CX breakdowns are impacting costs.

Customer defection
When customers leave your brand for a competitor, it’s more than just the loss of their transaction—you’re losing a relationship. It reduces the Customer Lifetime Value, and it may lead to more negative WOM marketing and defections.
Knowing how many customers leave your brand in a month, a quarter, a year or more is a very important metric to track, especially for business-to-business (B2B) companies or those with subscription-based models.
For example, if your CSAT or NPS scores begin to fall, they may be a pre-indicator of increasing customer defection rates. Even if you are acquiring more new customers each month, this metric should be tracked as an indication of how current customers are feeling about your customer experience.
Other CX key performance indicators
As you might have surmised, there’s no perfect set of customer experience metrics to track the complete performance of your CX program, but the list we’ve provided is a good starting point. There are also lesser-known options that may be more relevant to your business.
For instance, consider Customer Lifetime Value (CLV). This metric can be especially helpful for membership or subscription models, as well as other long-term customer cycles. One way to calculate CLV is to use the Average Annual Revenue per Customer multiplied by the Average “Lifetime” of your Customer, meaning how many years they have been a customer. Your CLV equates to the dollar amount you’re left with, and can be a useful indicator of the long-term financial value derived from keeping customers satisfied and retained over time.
Related: Increase customer lifetime value with surveys
Another popular metric within contact centers is First Contact Resolution (FCR). Knowing if your customer service agents can resolve customer issues the first time around can indicate the amount of effort your customers experience. This can be calculated on the overall level, or at an agent and product level. A typical calculation uses the total number of customer contacts resolved on the first attempt for a given period divided by the total number of customer contacts in that same time.
Tracking social media sentiment, digital behavioral analytics, and employee engagement feedback can also lead to more insights. To get an overview of how customers feel about your brand in real time, monitor your social media sentiment analytics. Their behavior on your digital properties—websites, mobile apps, and online search—can help you identify points of delight or challenges in the customer journey. Lastly, how engaged your employees feel is directly related to the experience they deliver to customers.
Feeling overwhelmed by CX metrics is understandable, so focus on a few vital metrics aligned with your top CX goals and build an actionable measurement system that fuels continuous improvements. That’s when the real fun begins—when your customer feedback-driven insights lead to real change. Stay committed by continuing to gather and apply learnings to enrich your customers’ experience. Progress only compounds when you keep the momentum going over time.
Editor's note: This guide was written in collaboration with CX expert Jeannie Walters.
Net Promoter, Net Promoter Score, and NPS are trademarks of Satmetrix Systems, Inc., Bain & Company, Inc., and Fred Reichheld.
Discover more resources

Customer satisfaction survey templates
Explore our customer satisfaction survey templates to rapidly collect data, identify pain points, and improve your customer experience.

3 ways to boost business growth by connecting SurveyMonkey and HubSpot
See how users are taking action on survey data to improve customer experience with the SurveyMonkey app for HubSpot.

How to use Forms to enhance your survey experience
How do surveys and forms differ? Learn how to combine form data with survey feedback for seamless events and experiences.

Beyond CX: How SurveyMonkey + Salesforce turn feedback into revenue
SurveyMonkey + Salesforce turn feedback into revenue
Put customer experience at the heart of your business